
Numerical Results From MaxHydro Run
Schedules
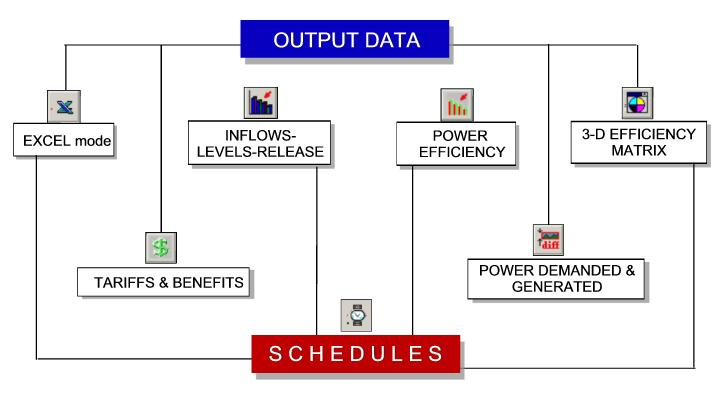
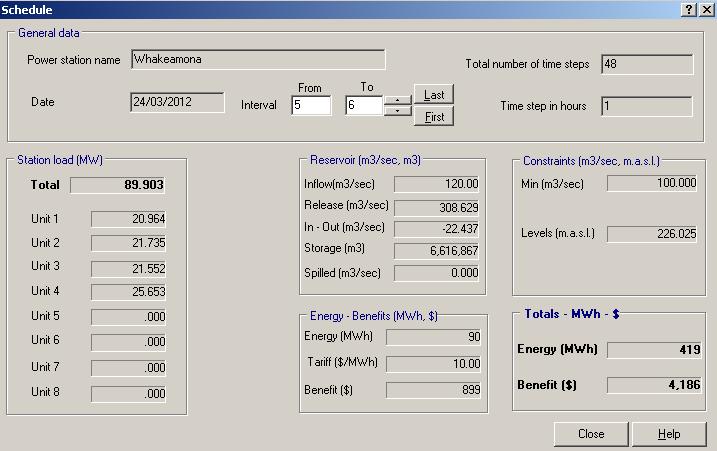
Output data is loaded and presented for each time step in schedules for each reservoir case. You can load schedules after running MAXHYDRO by choosing Schedules from the main menu or by pressing from the toolbar. A schedule table will be displayed as follows
Summary
A summary of the optimization results can be accessed from

Export data
The data from the grid can be exported to Excel or some other formats. Right click anywhere on the grid for the popup menu options as follows:


