
Long Term Optimization
METHODOLOGY FOR LONG TERM OPTIMIZATION
The best forecast of inflow to reservoirs, several months into the future, is most likely the historic average inflow for that period. However, an optimisation of reservoir operations using one 'expected' or single forecasted inflow sequence would lead to biased results and would not reflect the historic variability in inflow for the optimisation period.
Alternatively, the approach adopted is to carry out a series of N independent optimisation analyses, each using a selected historic inflow sequence, i.e. a stochastic analysis. The N independent optimisation results yield N unique release decisions which, if not further statistically analysed a long-term operation guidance could be developed.
The results from the long-term optimisation will be used as boundary conditions for guiding the short-term optimisation models to achieve the long-term global optimum of the entire system.
For example a1000 years of monthly inflow data could be generated using ARMA model. The record can be divided into 20 sets of 50 yearlong series. Then MaxHydro can be used to find the optimal solution of the optimisation problem for the 20 sets of data.
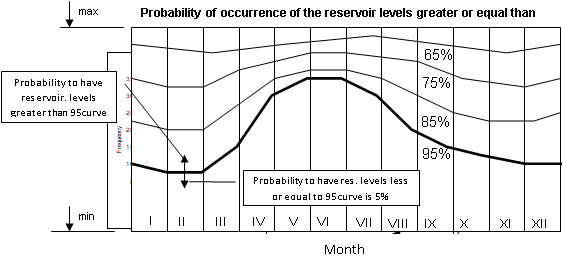
The results from the optimisation process will be 20 sets of output data, which are the optimal with respect to the objective criteria used. The results are grouped month-by-month and statistically analysed. To define the probability curves of the reservoir levels for 95%, 85%, 75% etc. probability of occurrence we use the cumulative distribution function (CDF) for that month which can be derived in Excel or other statistical software package.
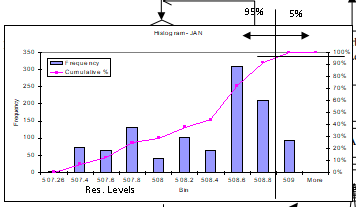
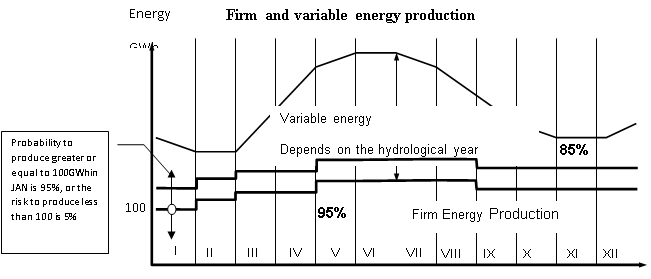
Similar to the above if we are interested to derive the firm energy production of the hydropower system and if the firm energy is defined as amount of energy that can be produced from the hydropower system with reliability of 95%, then for each month CDF of the optimal energy production is derived and values for 95%,85%,75%, etc. are estimated. The resulting probability of occurrence of the firm energy is shown on the next figure. The area below the line represents the energy production. For example the firm energy production is the area below the 95% probability line, that is the amount of energy that can be produced with 95% probability or in other words the risk of not producing that amount of energy is 5%.
The probability rule curves method does not define a single operating rule curve but rather a space with the associated probability. This information can be very useful for the system analysts and planners to define the annual plan of the operation of the hydropower system.
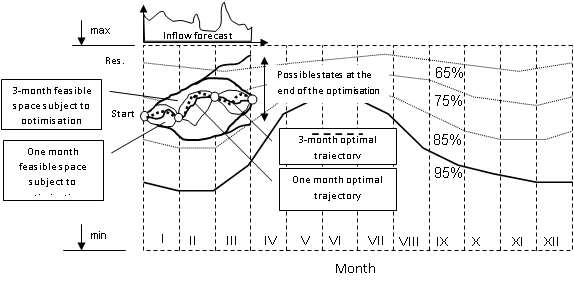
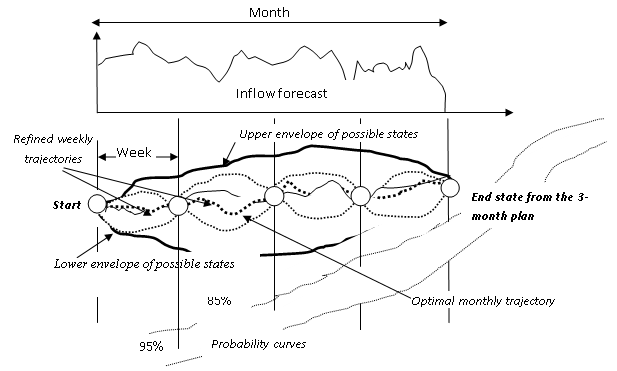
The hydropower system has to be operated in accordance with medium to long-term plan of operation. As a first approximation one-year period can be used. The annual plan can be derived based on some kind of forecasted inflow series. The accuracy of the annual plan can be increased by defining shorter quarterly plans, based on a shorter inflow forecast, which is more accurate. The generation plan is also refined by using more accurate shorter, 3-month forecast generated by the inflow forecast module.
MaxHydro set up in long-term mode will be used to optimise the hydropower system at this stage of the planning process. It can be set up with different objective functions, and system constraints. The analysts and the planners define their what-if scenarios and run MaxHydro. The results of each scenario are loaded and kept in a database for further analysis. In addition to the inflow series the following data need to be defined:
- Staring position of the reservoir (known)
- Inflow for the next 3 month (known )
- Hydropower system characteristics (known)
- The optimisation criteria (known )
- The reservoir level or storage at the end of the planning 3-month period (unknown)
The selection of the end level/storage is in the hands of the system operator or planner. The state of the reservoir at the end of the 3-month period would be selected based on the aims of the plan. Operational conflicts exist between maintaining generation head as high as possible and reducing the risk of spilling. For example:
- A high reservoir level will improve station efficiency for energy production, but may run a high risk of water loss through spill.
- A low reservoir level will utilise more water and produce more energy but at lower station efficiency, with less risk of water loss through spill.